Minutes posted this week for the April 23, 2018 meeting of Senate contained a significant correction.
A chart on overall full-time faculty distribution that had been handed out at the meeting seemed to show that tenure-line hiring was trending up significantly. The correction in the minutes shows that that is not the case. Tenure-line numbers have risen by 5%, not 23%. See the two charts below for a comparison.
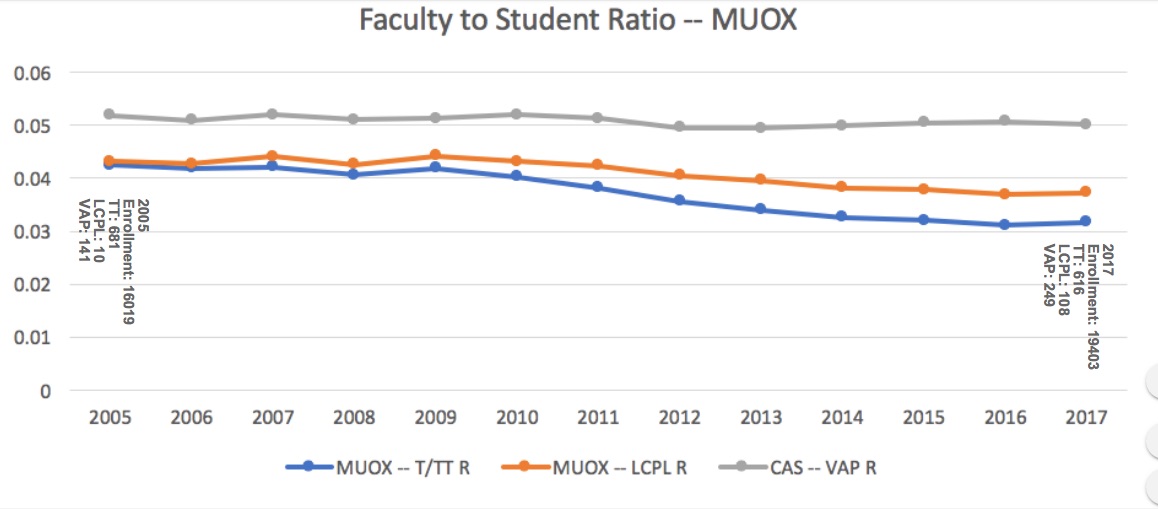
It’s important to draw attention to these corrected numbers. But even correct data on faculty numbers mean little without context. To understand real trends, we need to look at ratios of faculty to student enrollment. Scroll to the end of the post for a graph showing ratios of tenure-line, LCPL, and VAPs in relation to student enrollment (for Oxford).
You will see that tenure-line faculty have declined significantly in relation to student enrollment—and because LCPL numbers (orange) are tied to tenure-line (blue), it’s mostly VAPs (gray) who are teaching all those extra students.
As you take a look, consider the following two questions:
– Why is Senate speeding toward a last-minute vote to increase the percentage of LCPL without discussing the overall ballooning of non-tenure-track faculty at Miami? (NTT now teach about 60% of credit hours and are the new majority.)
– And why, given this context, have the resolutions proposed by seven senators seeking to preserve tenure and improve academic freedom and due process for NTT faculty not been put on the Senate agenda?
______________________________________________________
Chart distributed at Senate Monday (incorrect):
(increase of 132 TT faculty).
Corrected chart:


Leave a Reply